Page Sections
Analyze your spending trends and identify anomalous behavior to reduce unexpected cost surprises.
Why: Keep control over your application's spending by tracking your costs and detecting anomalies.
The cost anomaly detection will help you to keep control over your applications’ costs using algorithms that compare your current spending to the previous ones and build the trend for your applications. When your actual cost incurred deviates from the expected one then it can be a potential cost anomaly.
Your application cost trend will be always available no matter if the anomaly was detected or not.
How it works
Klarity anomaly detection models are using historical data to identify the costs which deviate from the expected costs. In order to avoid false-positive anomalies, the model takes into account various components such as trends and seasonality.
Klarity analyzes 90 days of data to estimate the confidence zone where the cost is considered normal. You can adapt your own global anomaly policy and decide what % of deviation from the trend is an anomaly for your applications by setting the anomaly threshold. If the actual cost incurred deviates beyond the set threshold, Klarity marks this behavior as a potential anomaly. Klarity includes also root cause tracking for all potential anomalies.
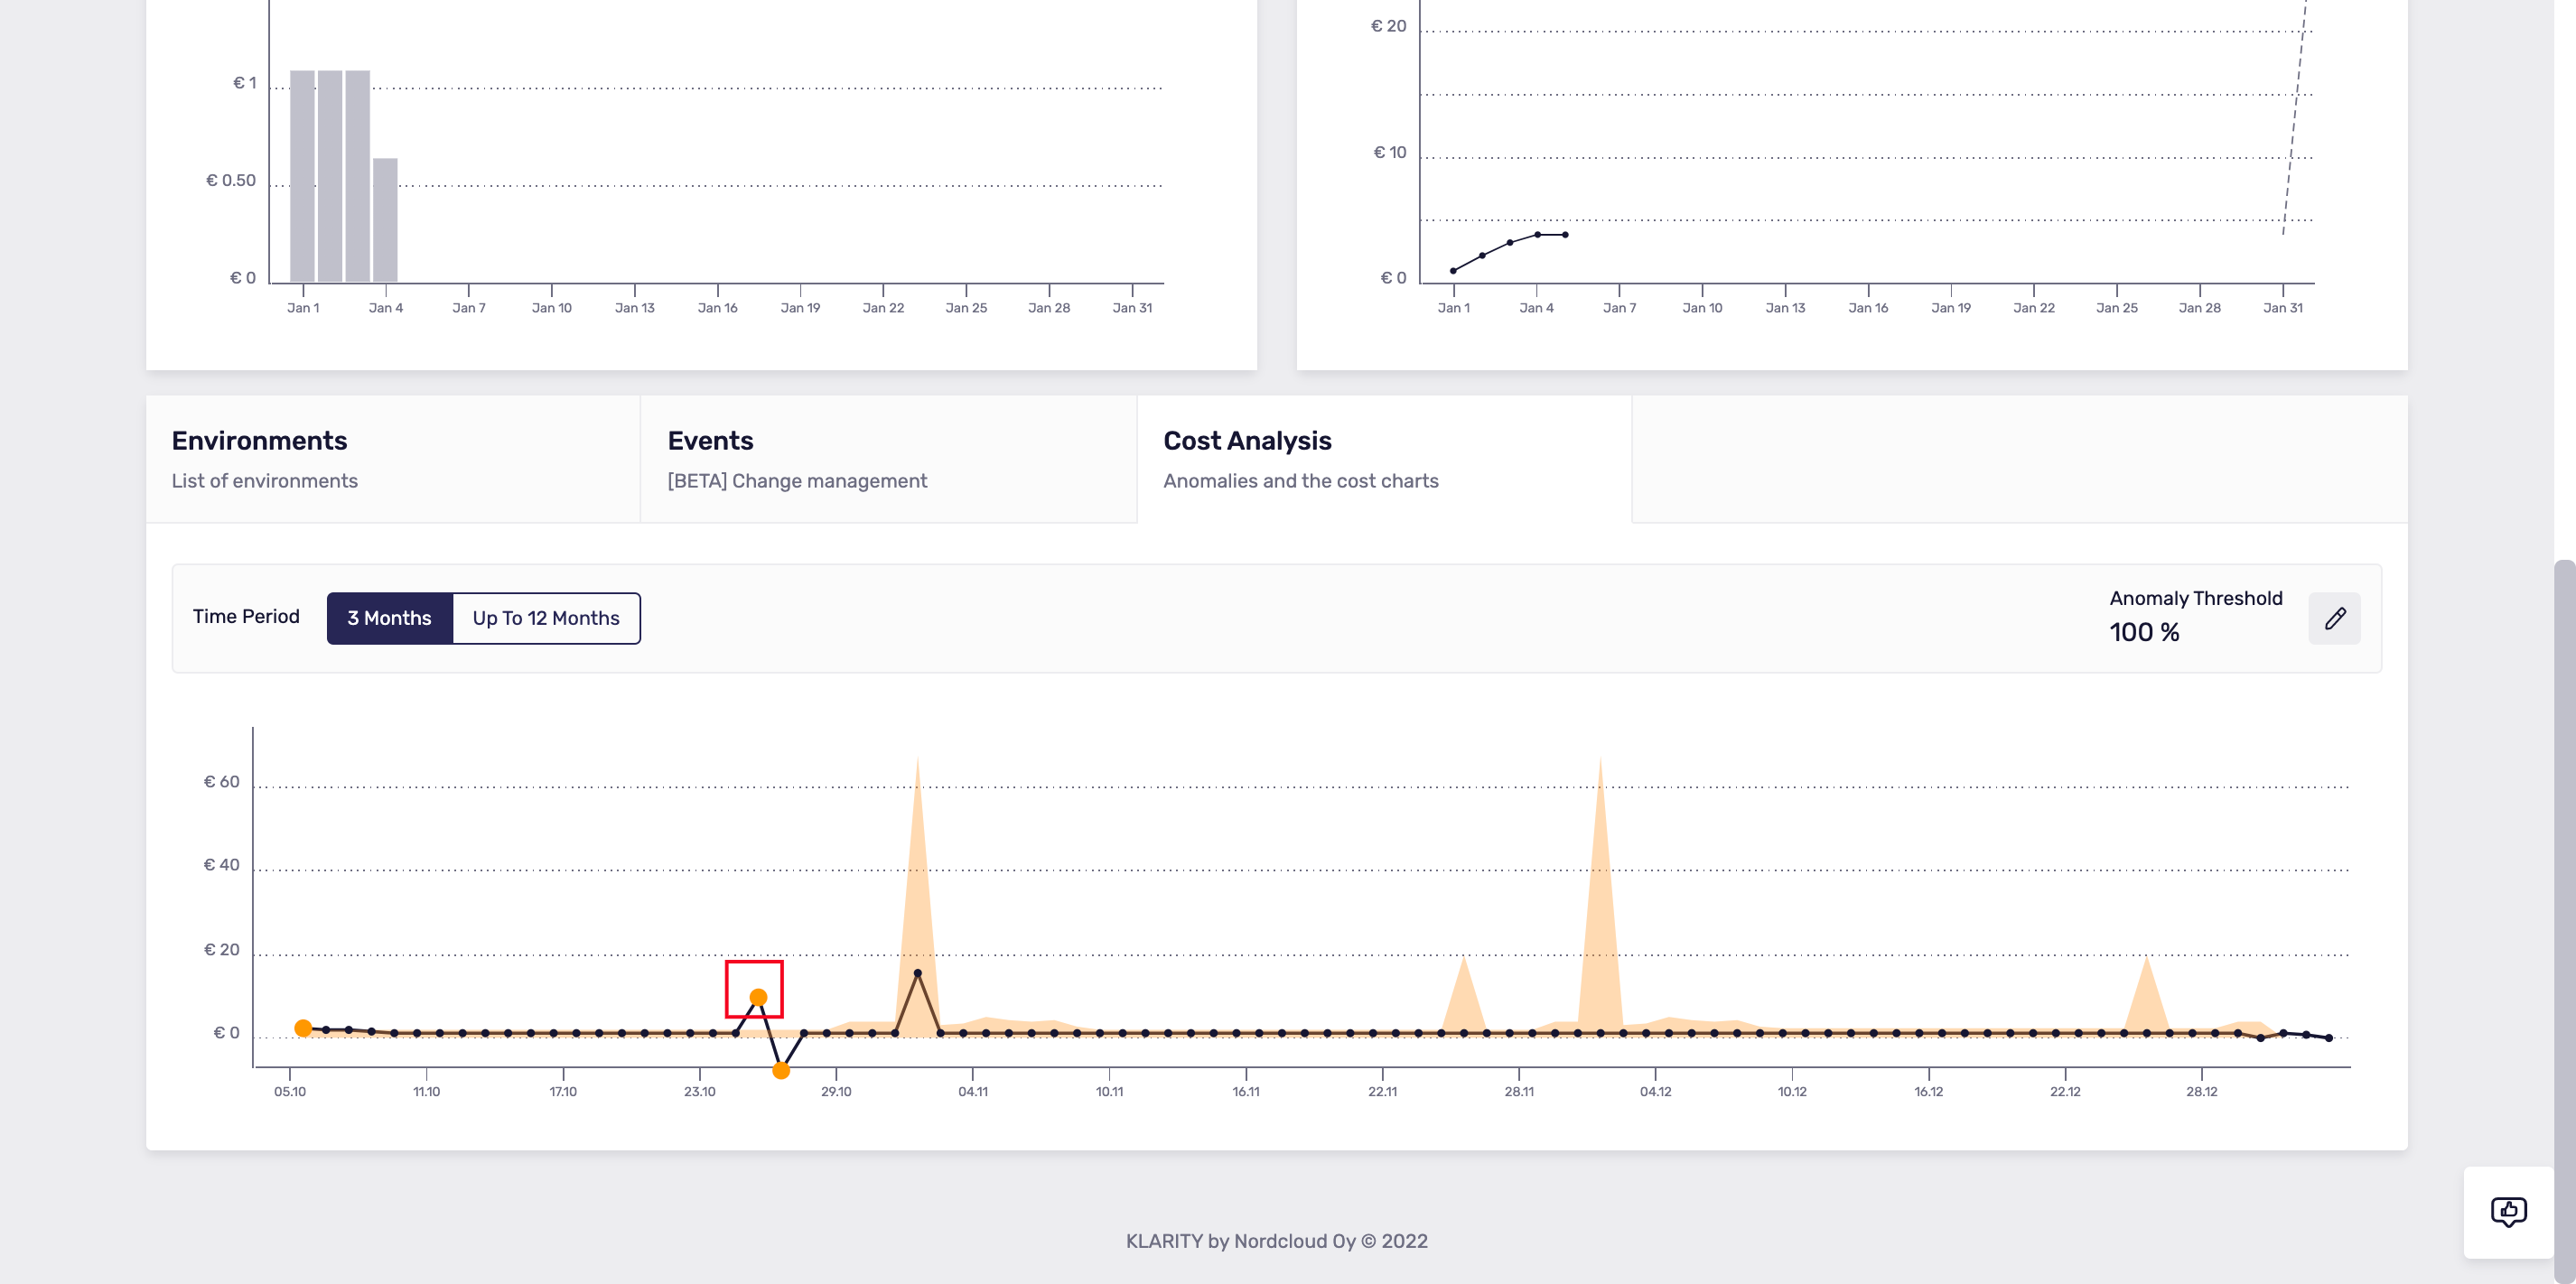
Charts for analysis
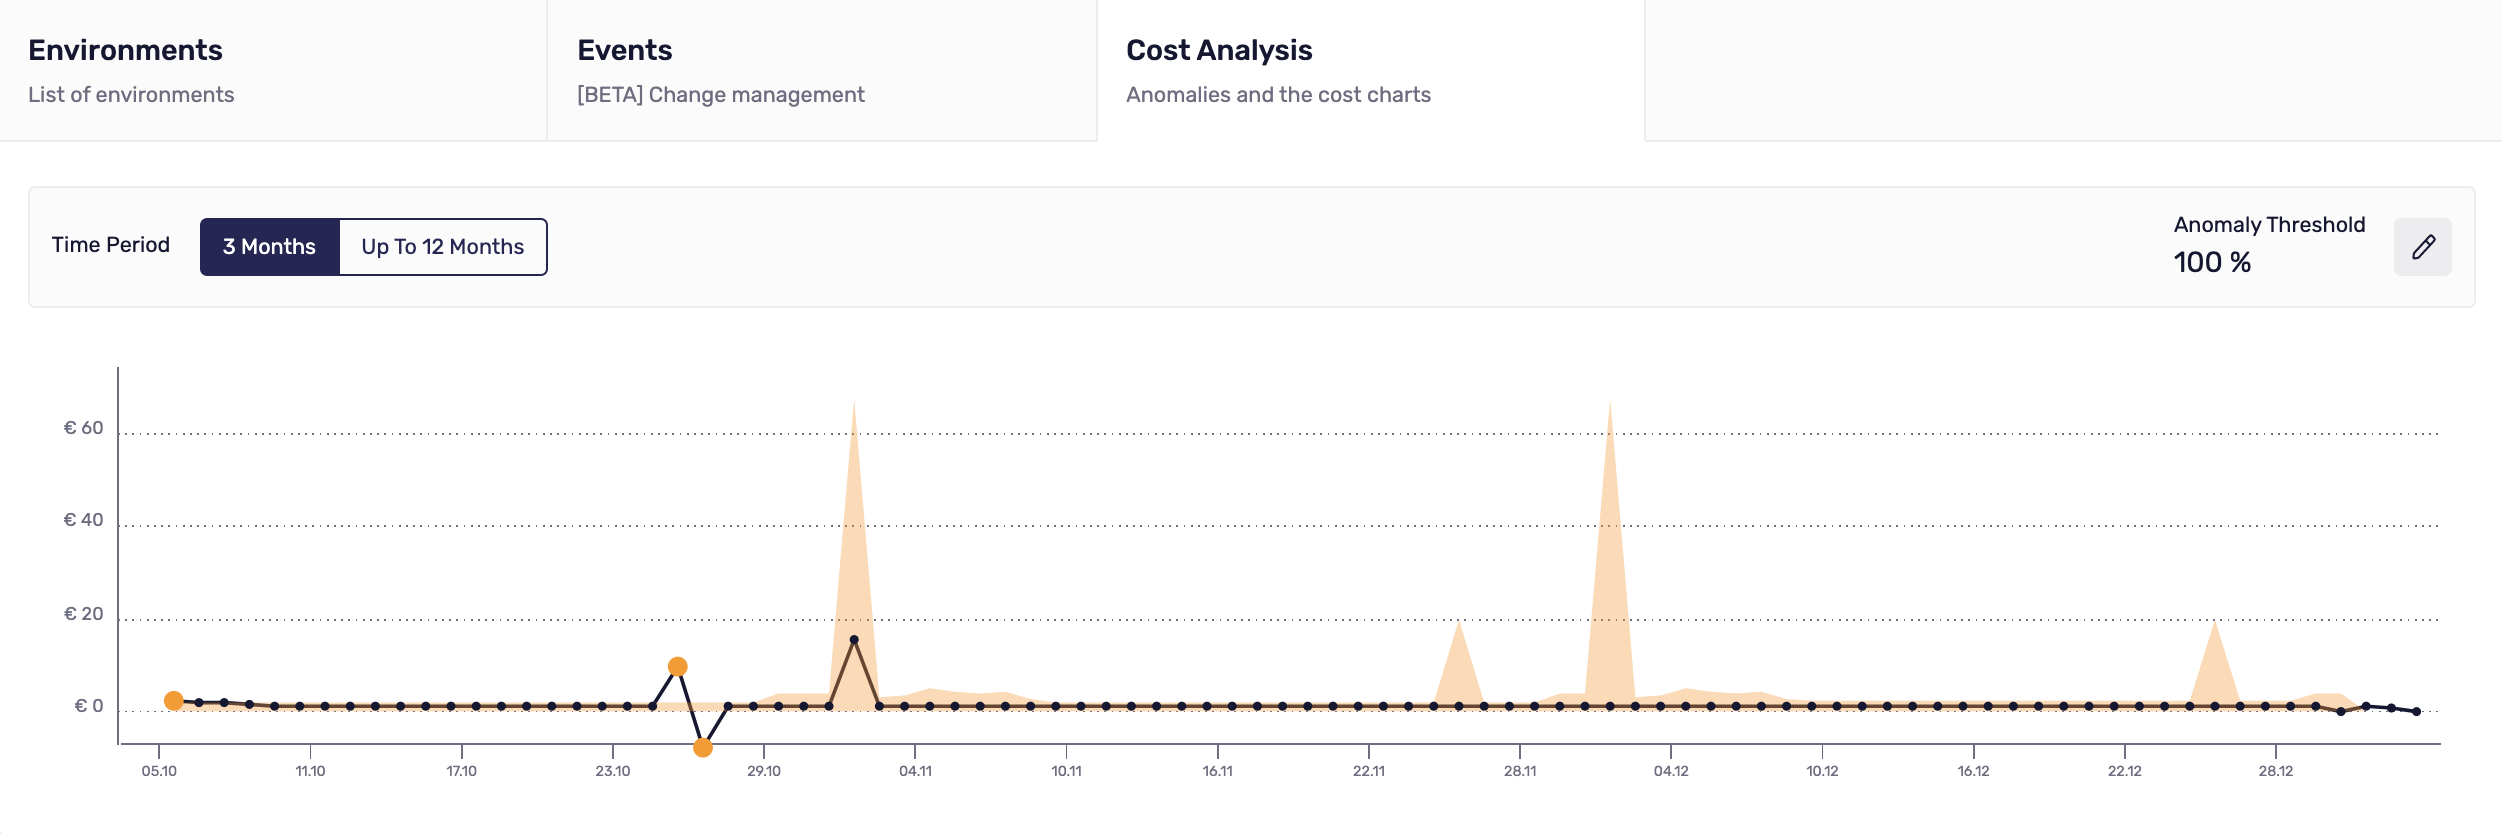
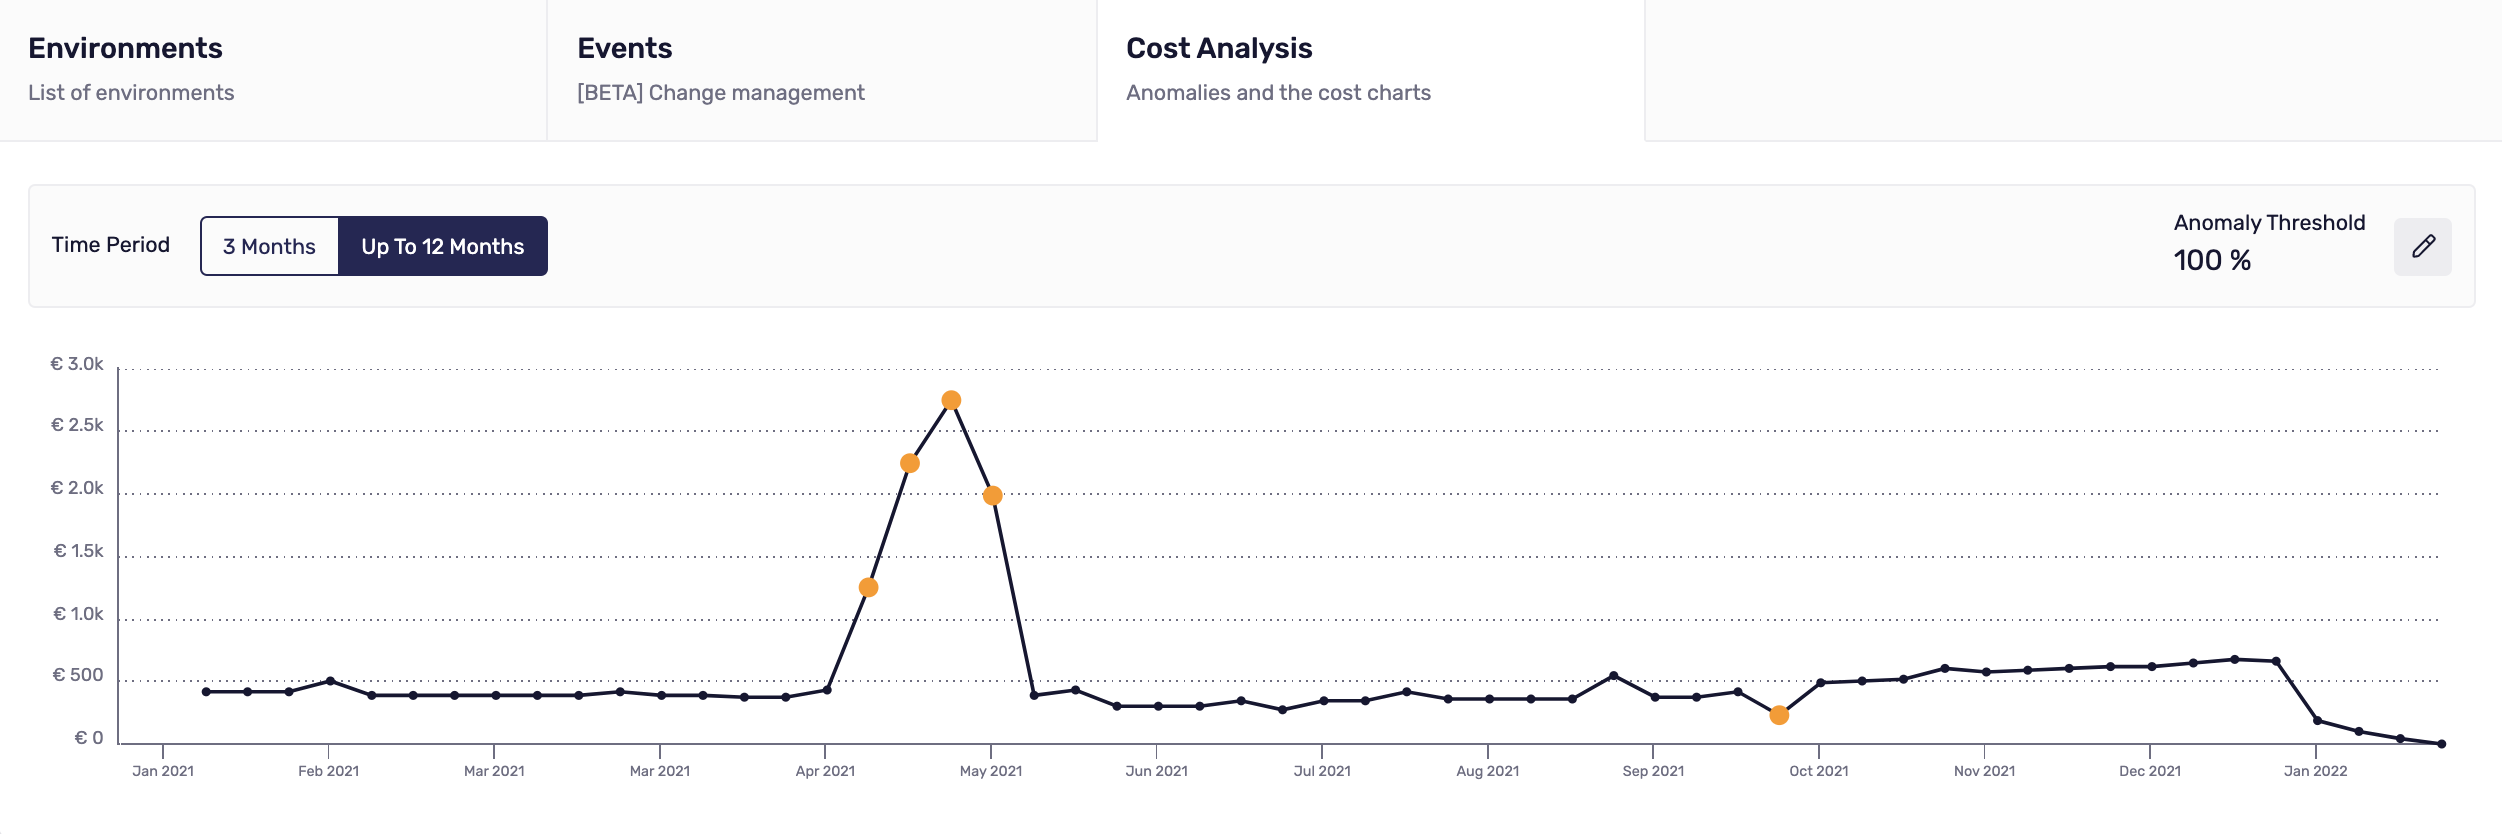
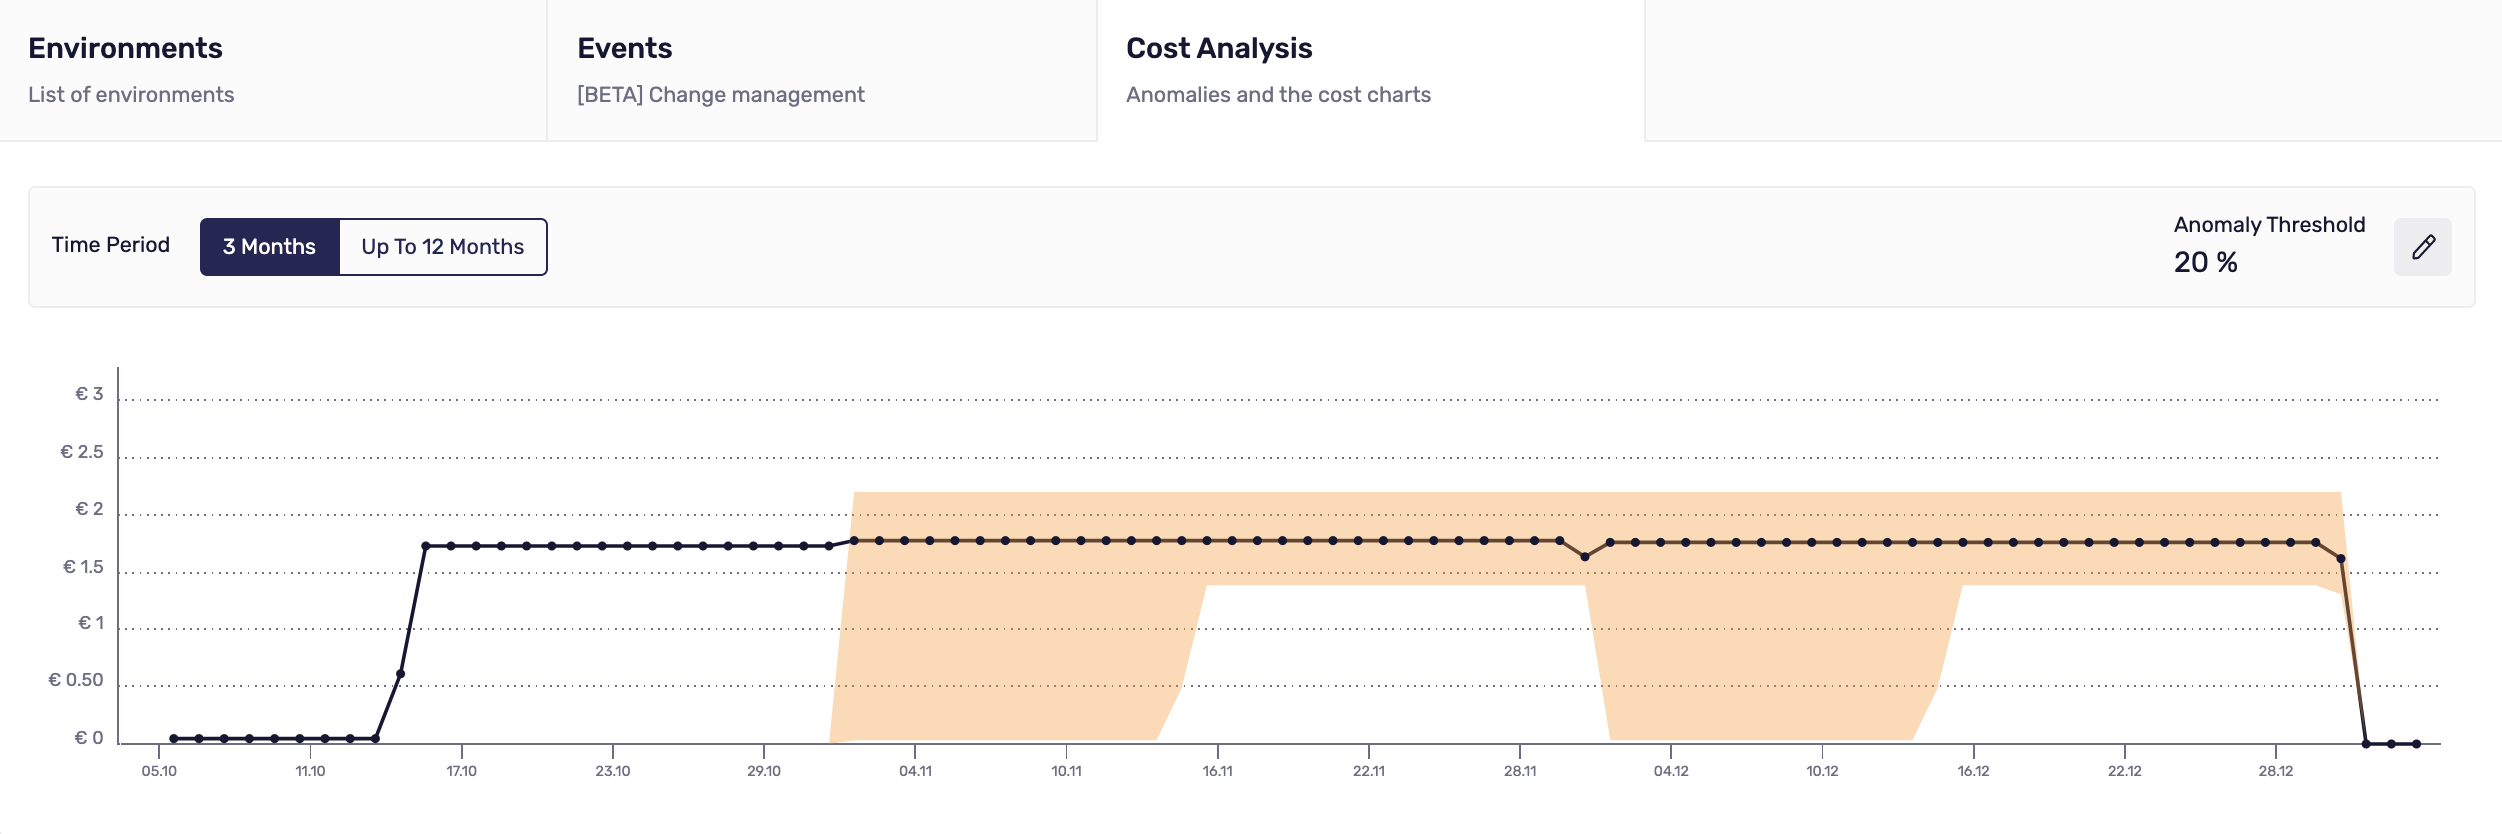
All the data: cost trend, anomaly threshold, and potential anomalies are visible on the chart where you can decide what timeframe you want to analyze. Choose from:
Last 3 monthswith the daily data granulation
Up to last 12months with weekly data granulation
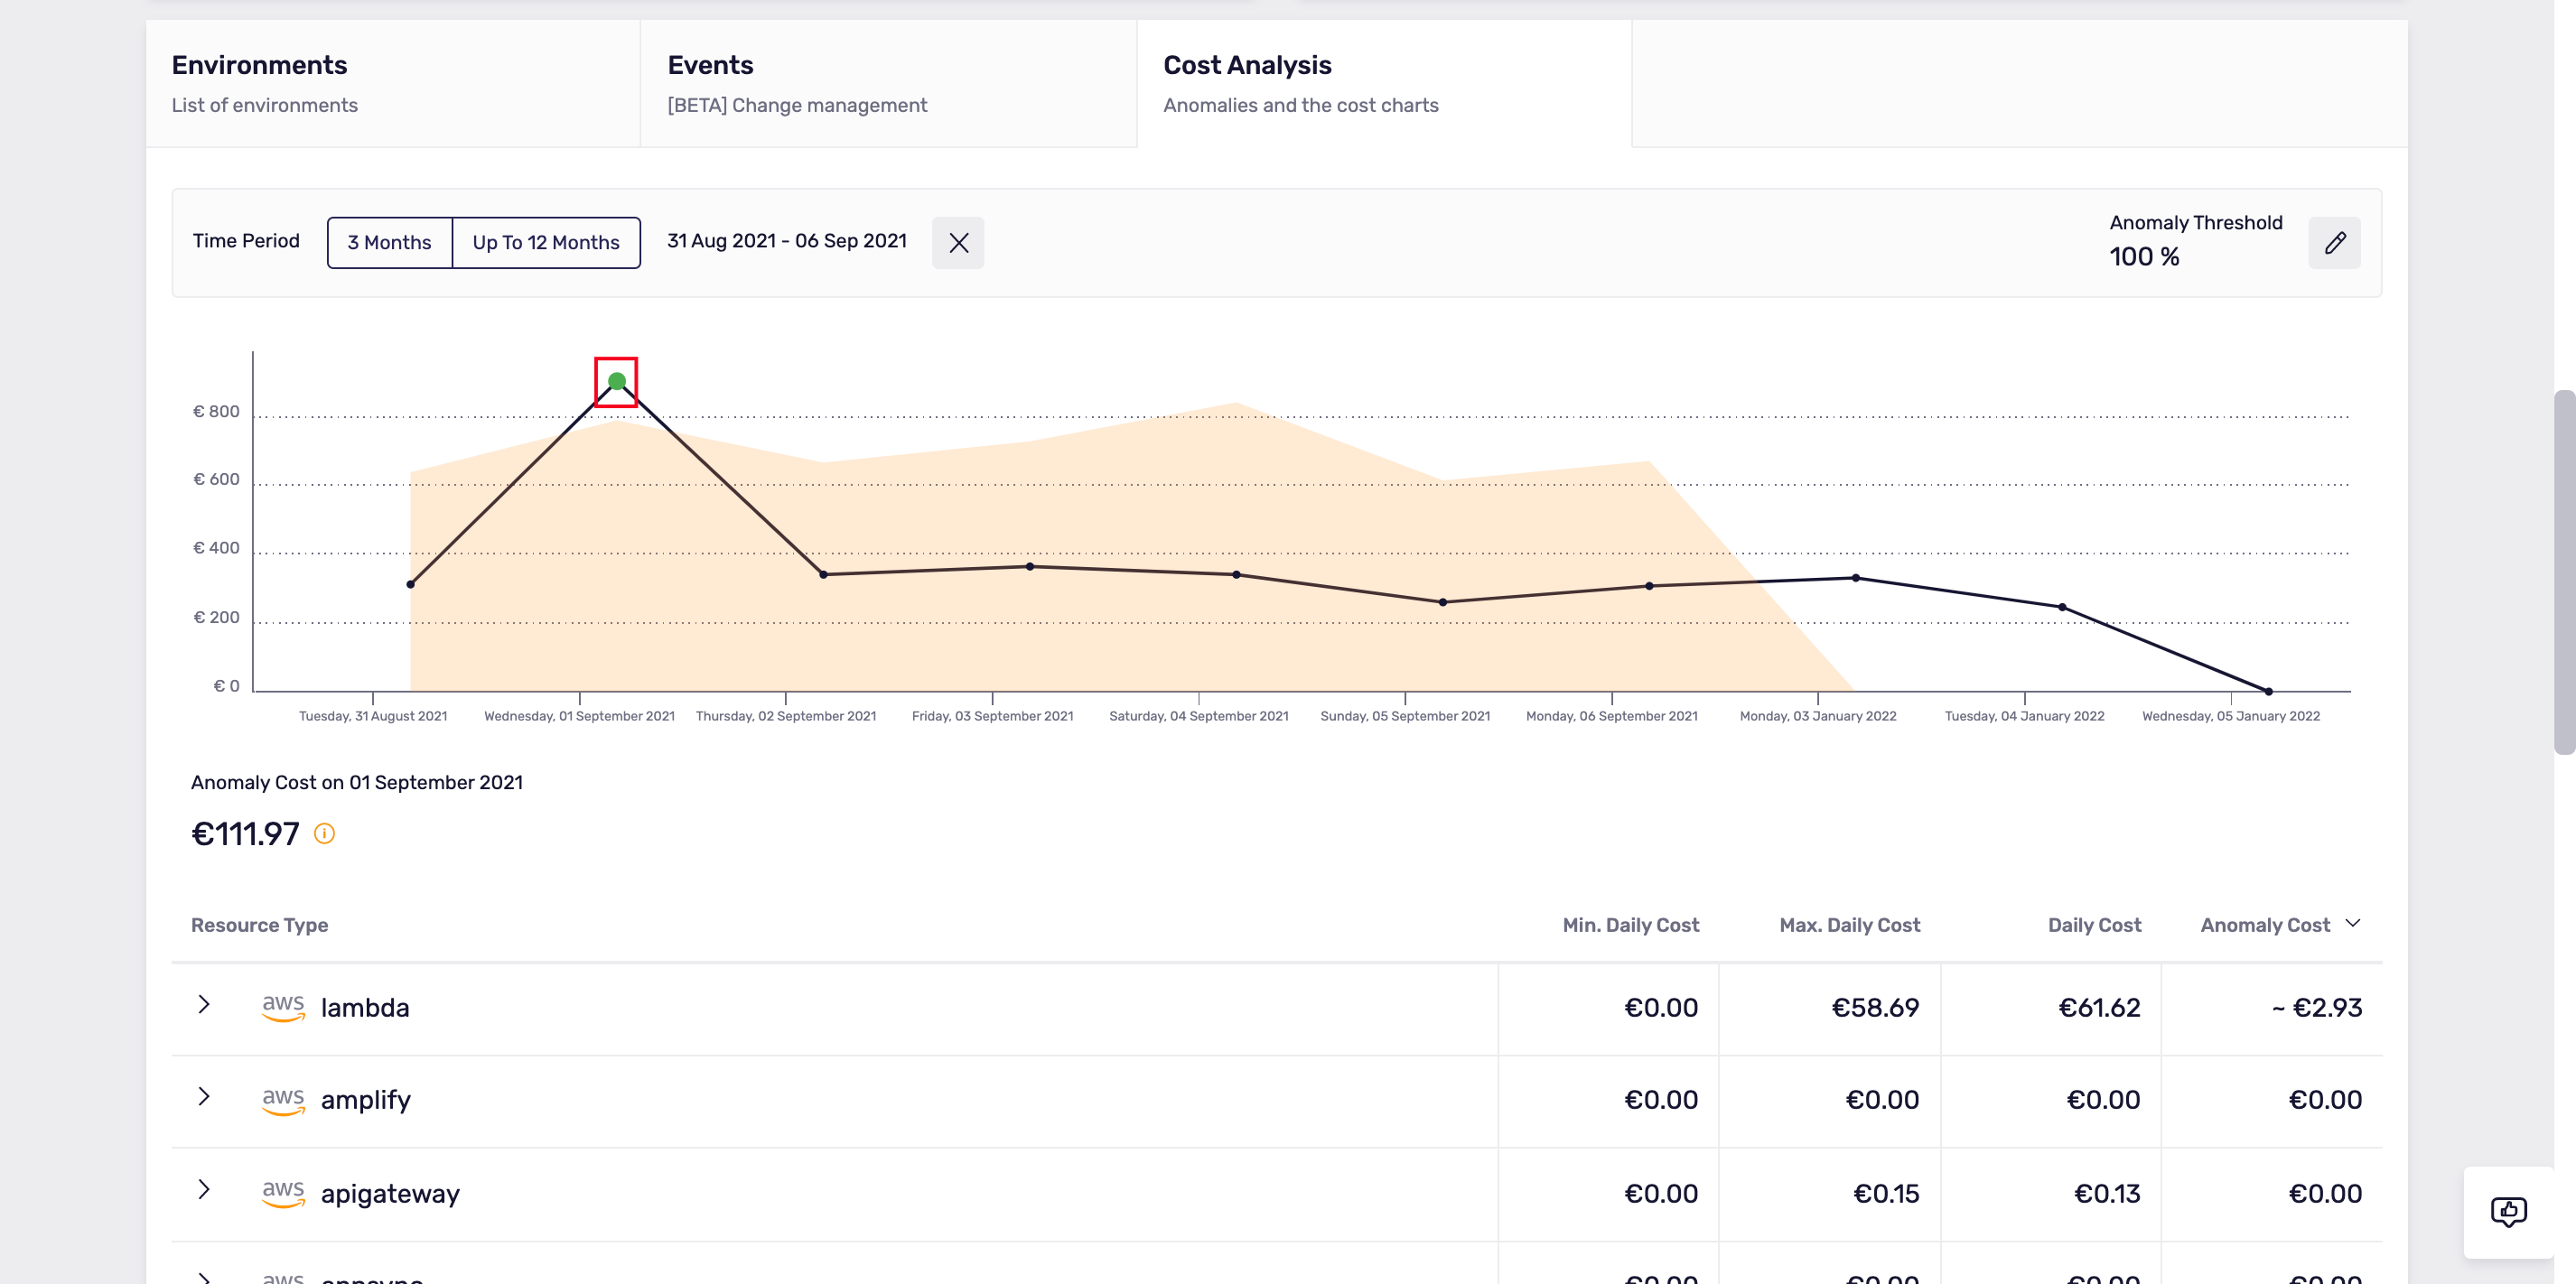
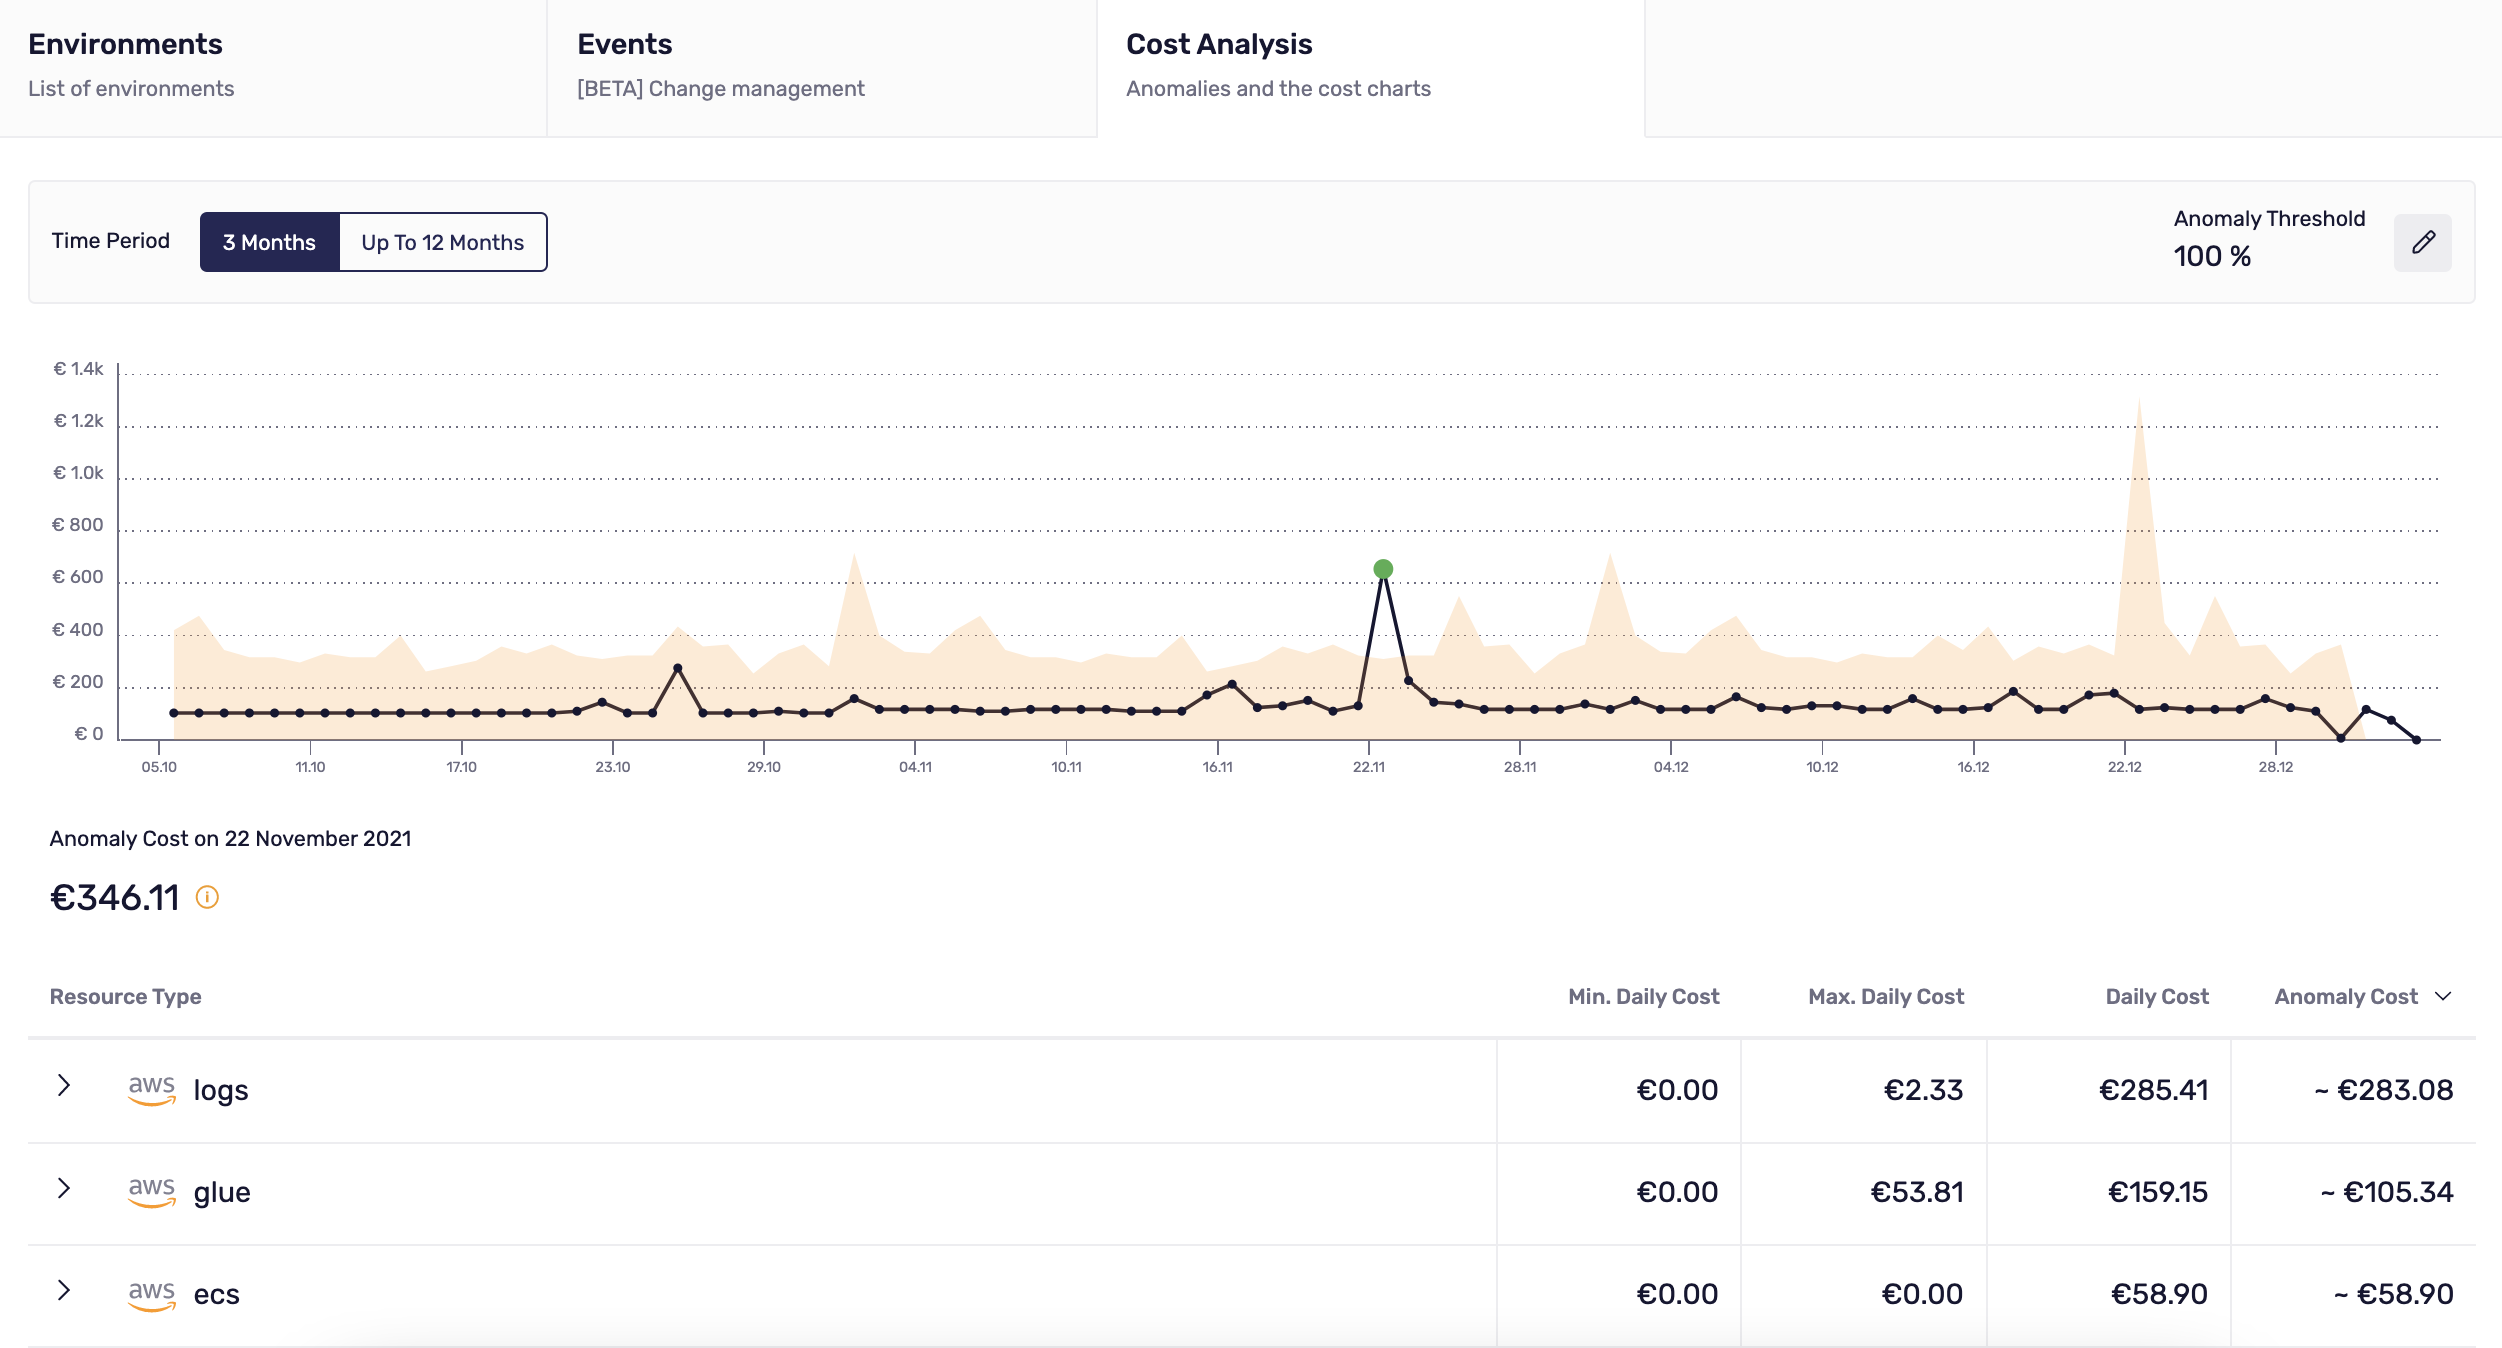
For each anomaly discovered by Klarity, you can analyse its root cause. Table with detailed data will appear when you click on the anomalies visible on the chart:
When Klarity does not have 90 days of data to analyze the cost anomalies, or when there were no anomalies found within the application you can still see the cost trends for your spending analysis.
How to use
View the Cost Analysis tab from the application details
Klarity finds the data about cost trends and anomalies on the application level. Simply go to your application details from the list of all applications, scroll down, and click on the Cost Analysis - Anomalies and the cost charts.
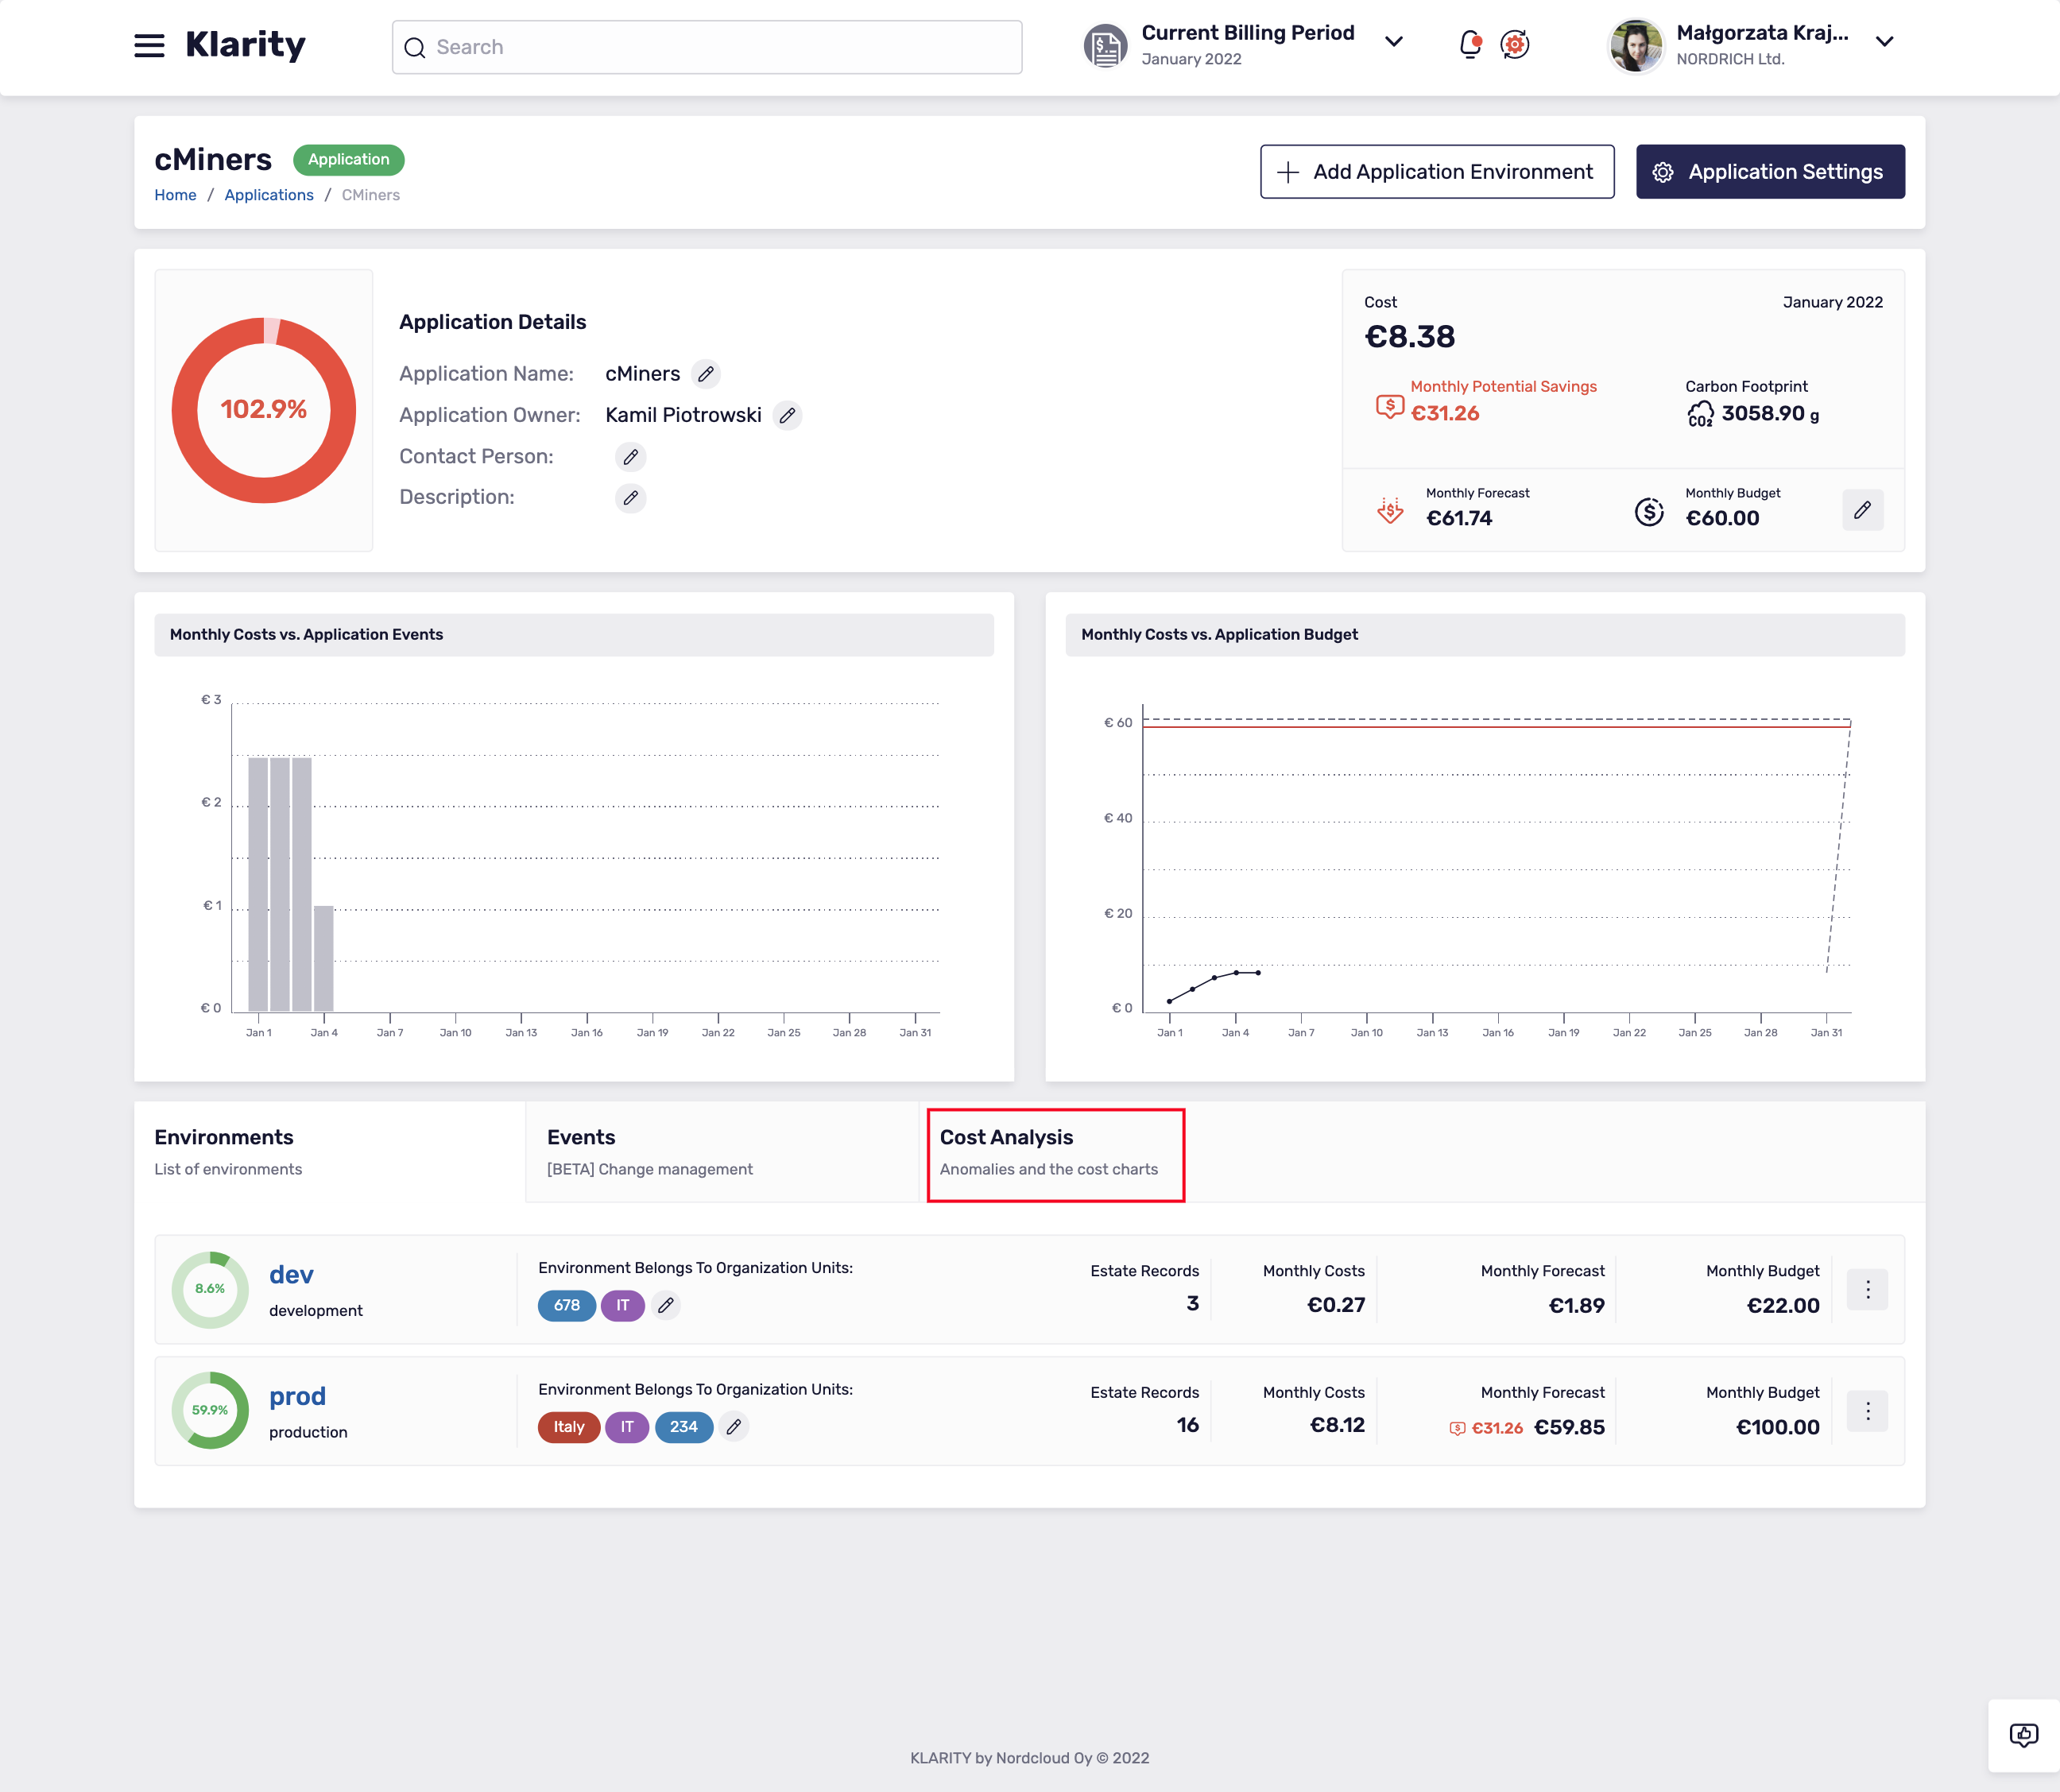
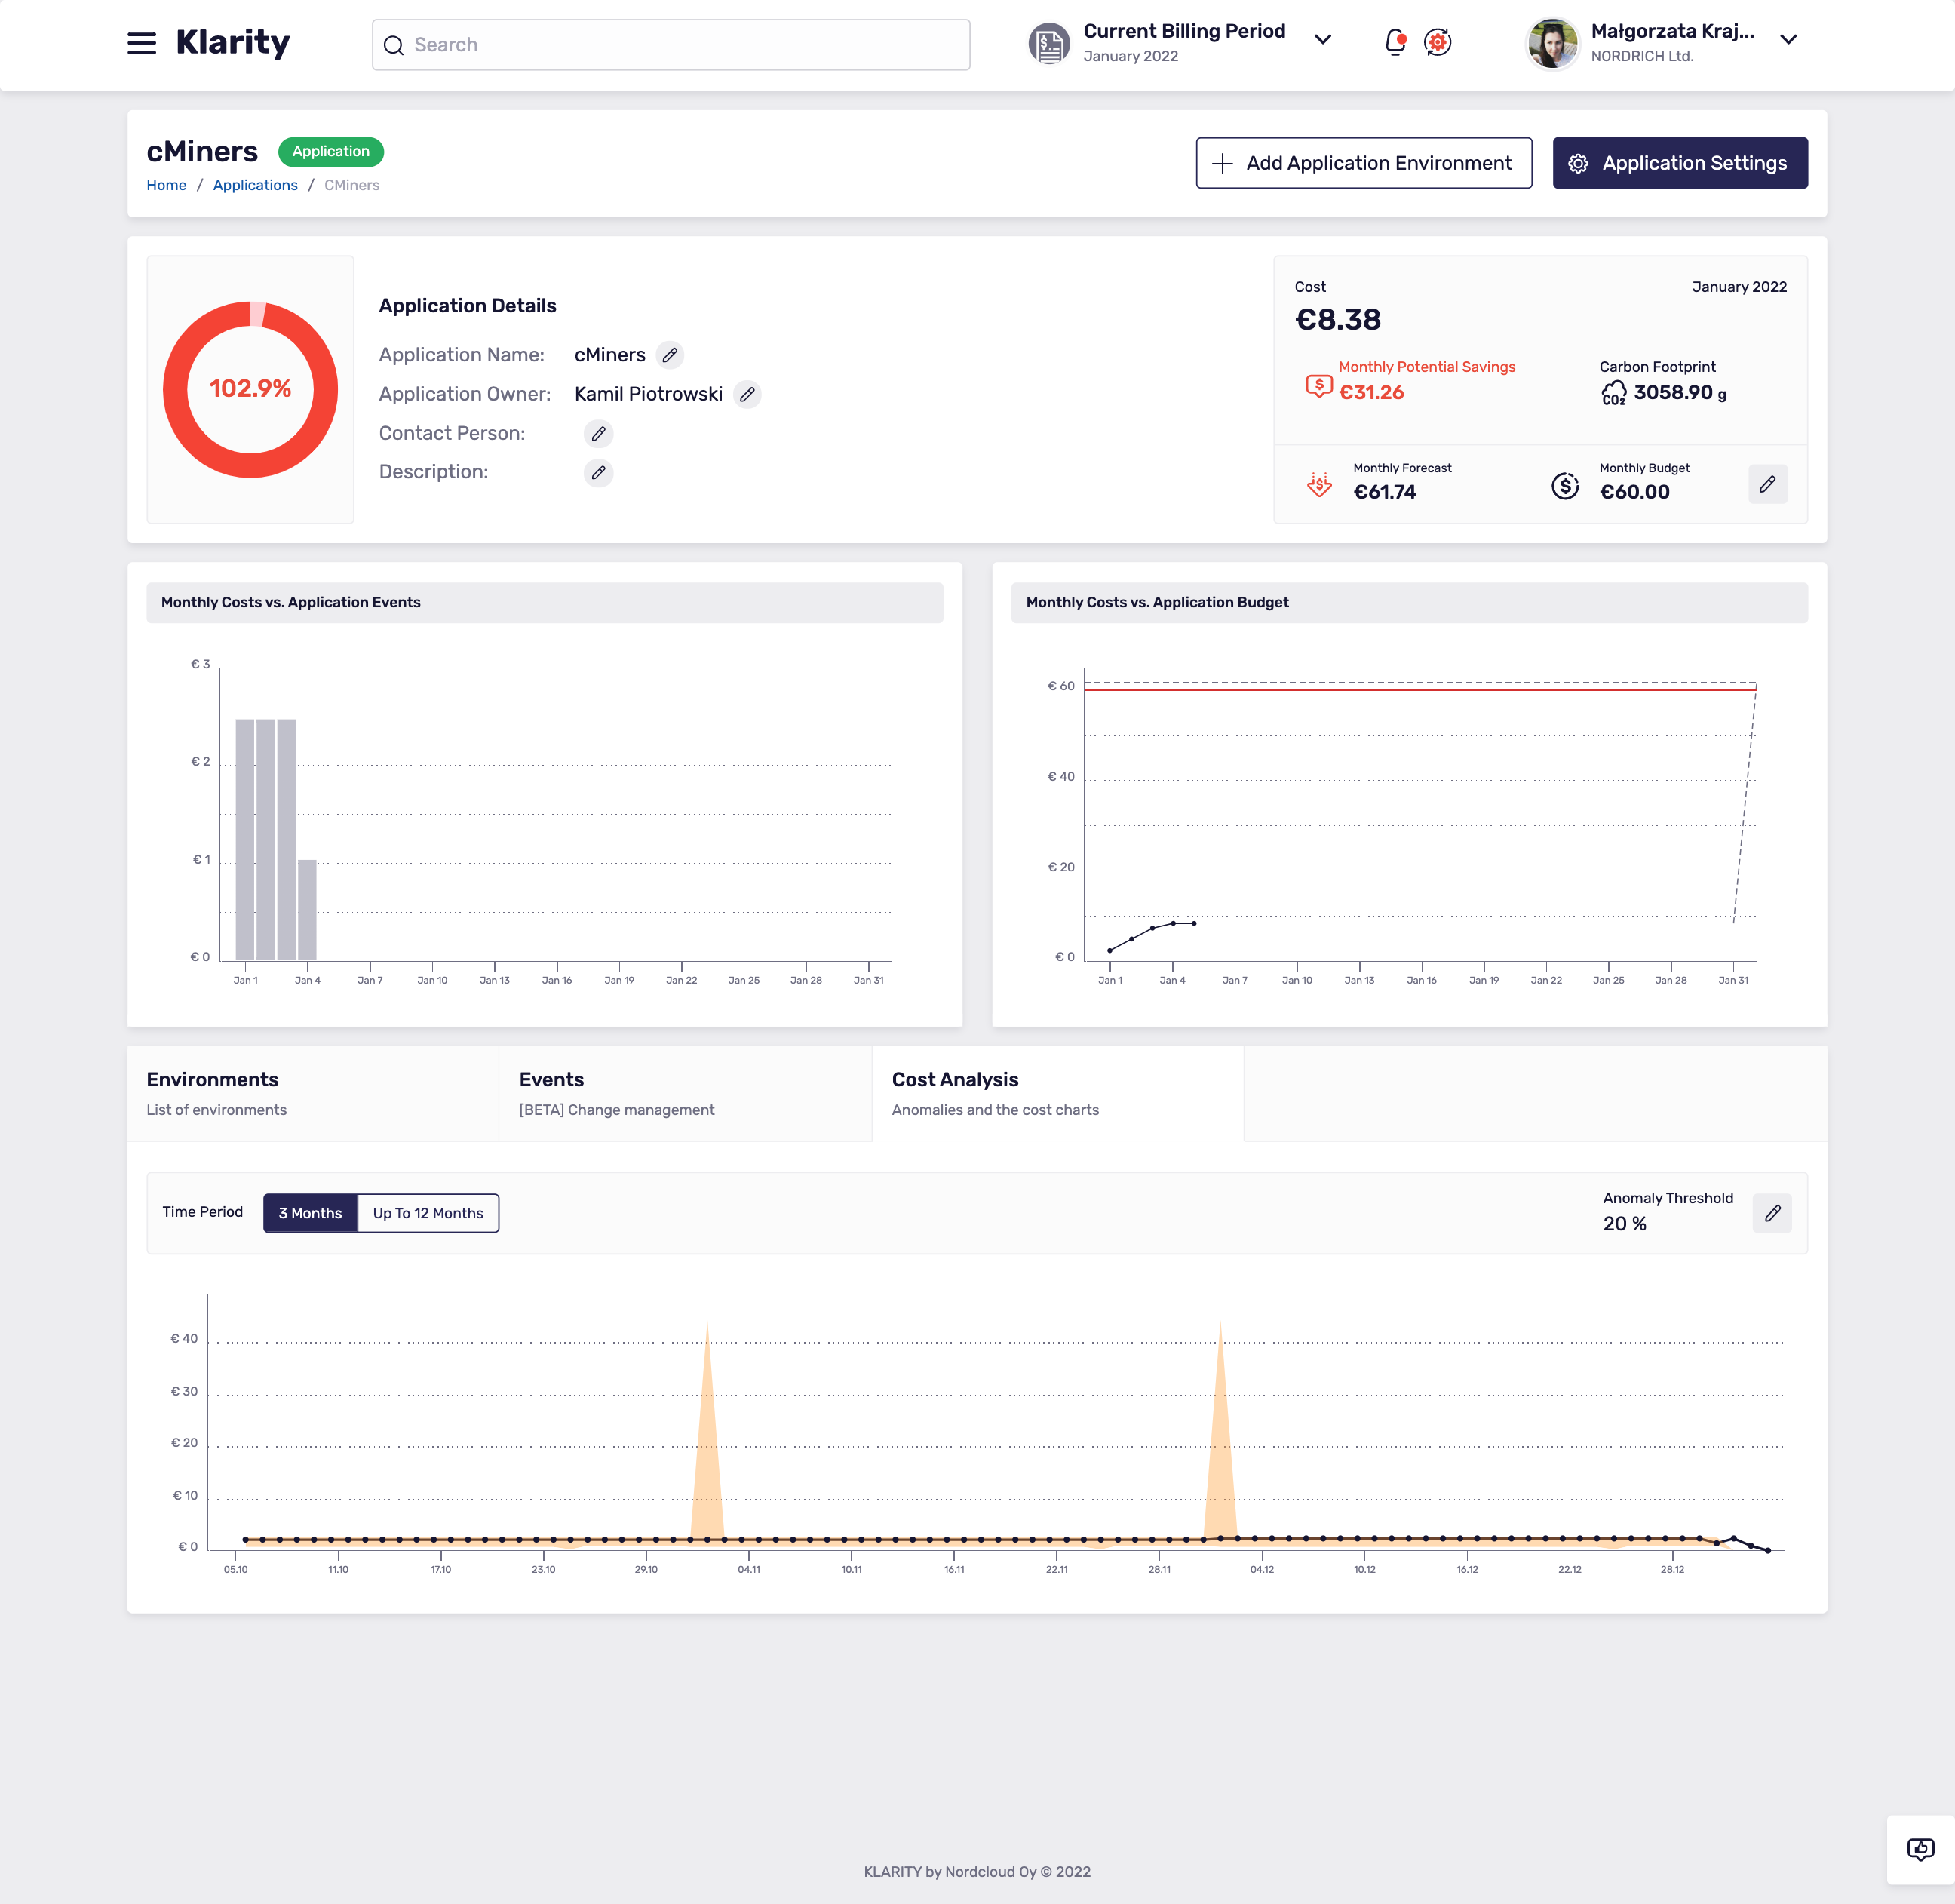
If Klarity found the cost anomaly in your applications - you will see the orange anomaly badge.
![]()
Set up your % threshold
You can define the anomaly threshold as a global value for all applications. This value represents how far real costs must go above and below the expected costs, to be considered an anomaly.
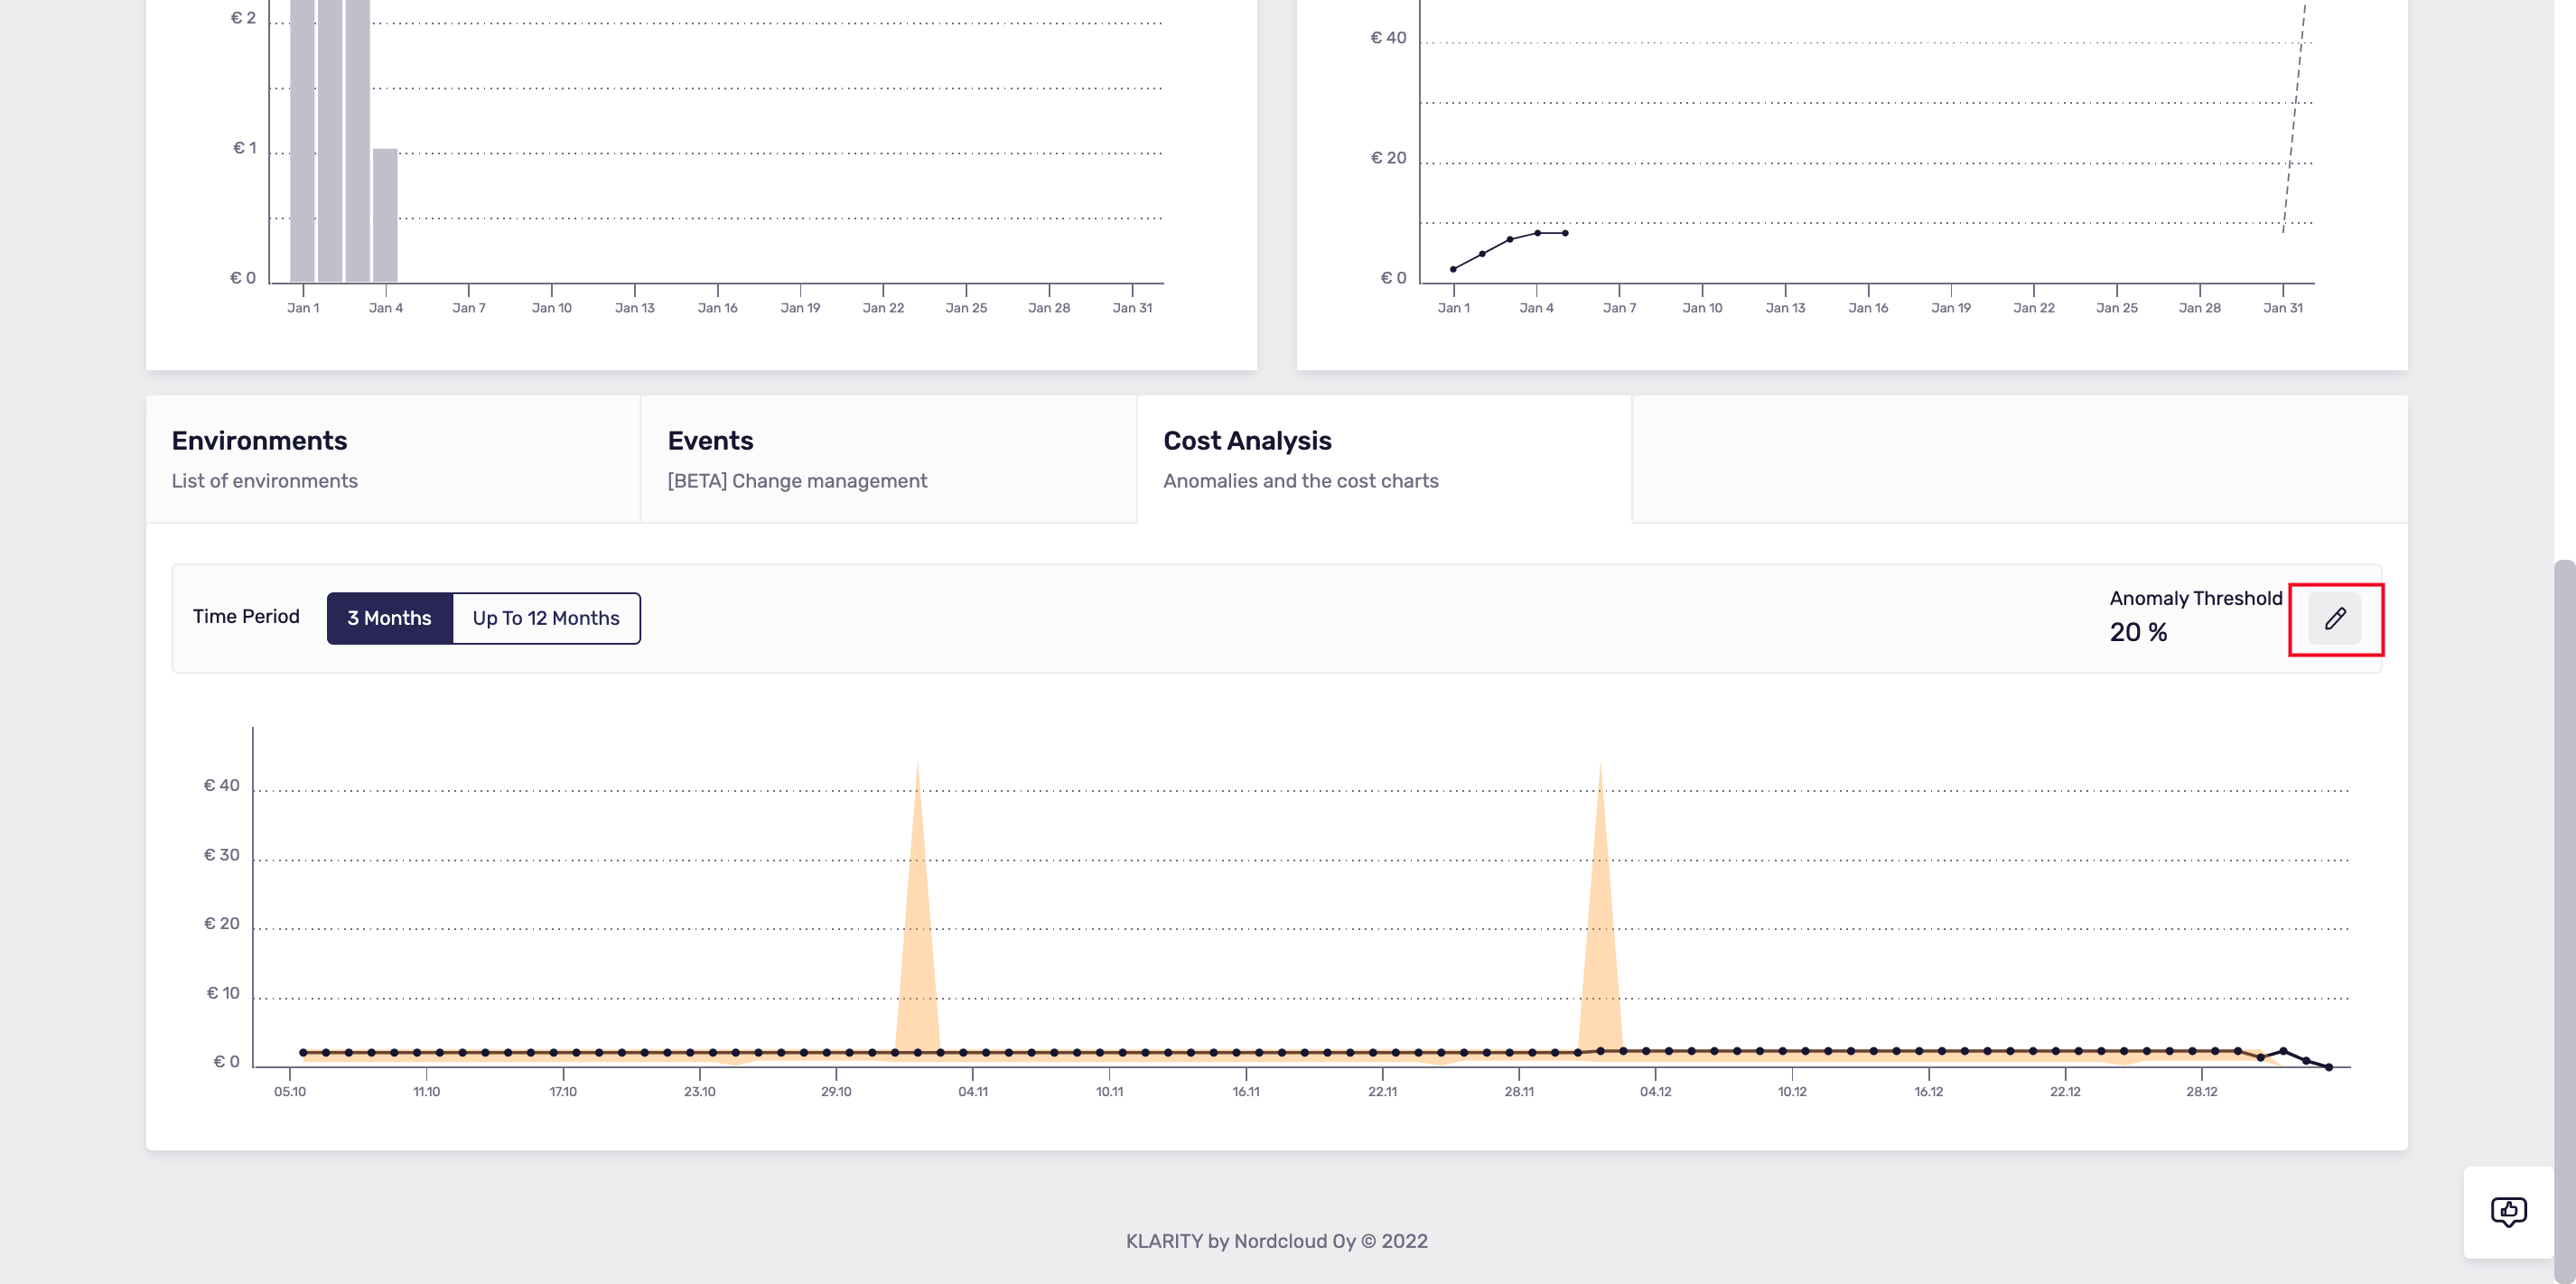
To change the anomaly threshold value for all applications, click the pencil icon next to the Anomaly Threshold in the right top corner of your anomaly chart. After the change, the system will recalculate immediately the anomalies and show new data calculated according to the new value.
The default threshold value is set up by Klarity on the level of 10%.
Drill down anomalies to meet the root cause
When Klarity will find the anomaly in your application you will see the anomaly badge on the list of all your applications and you will also see the orange dot on the analysis chart in the details of your application.
By clicking on the orange dot you can drill down and search for the root cause of your cost anomaly using the chart that will appear under the chart.